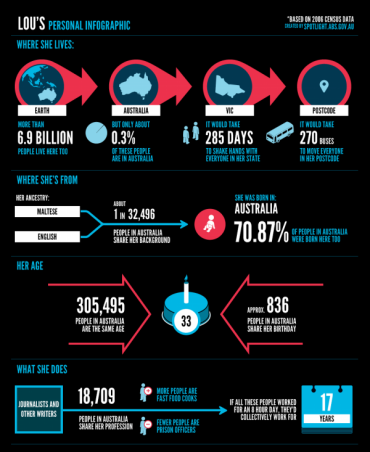
Data entered by each individual who engaged with the ABS Census Spotlight Personalised Movie was provided with a customised Infographic that used their real data
Many regular readers of this blog will know that I love data. Really, that’s why I love digital marketing so much. I love that you can track everything that you do and give the user a better experience when targeting is done properly. I’ve given numerous examples of how data has been used well to provide a positive user experience. So I am very happy to report that Leo Burnett, a well established and respected advertising agency, with many offices around Australia, has been awarded the Best in Show award by the Internet Advertising Bureau Awards in July 2012 for their work with the Australian Bureau of Statistics (ABS) to promote and encourage participation in the very important, but sometimes perceived as tedious, National Census.
The Census Spotlight campaign managed to turn data collection into something sexy – well at least to me. To others, it made the data and why it’s important to collect it, relevant. By personalising an animated film, made with real census data, the ABS was able to make an emotional connection with each of the 250,000 people who visited the site and entered their information to see what interesting facts they could find out about themselves.
In the video example above, you can see how the use of infographics help to illustrate numbers that are often too big for many of us to comprehend. When understanding Australia’s population in relation to the rest of the world, or how long it would take to shake the hand of every person in our country and that over 700 people in Australia might have the same birthday as you. The use of humour and a light tone of voice makes the campaign personable and worth sharing. It turned a dry and boring task into something interesting.
So interesting in fact, that over 250,000 people visited the Spotlight Census Personalised Film website – and that was without a single dollar spent on paid advertising. That was all through social media, word of mouth and press coverage.
- Of those 250,000 people who visited the site, 37,000 of them entered their personal data and got a customised infographic, made from their real census data, that they could download and share via facebook and twitter and other social networks.
- If that didn’t tell you that this was one very sexy and entertaining piece of data work – does knowing that the average time spent on the site was 4 minutes and 42 seconds convince you? Most of us don’t spend that long reading the newspapers online, let alone entering personal information and looking at census data.
So simple data about ourselves, such as gender, age, location, background and occupation allowed the Spotlight tool to customise over 20 points of data, making millions of possible variations (all needed to spit out those personalised infograhics that you shared on facebook, created what I think is the greatest data mashup of all time. Or at least, on my time.
Now do you love data too?
Get your own Infographic at Spotlight Census.
The

It is a shame we can’t access this anymore.
I used to use it with my Maths classes.